k-means clustering is a method of vector quantization, originally from signal processing, that is popular for cluster analysis in data mining. k-means clustering aims to partition n observations into k clusters in which each observation belongs to the cluster with the nearest mean, serving as a prototype of the cluster.
Although it is one of the simplest models for clustering, it is vastly used in many data science applications.
import random # library for random number generation
import numpy as np # library for vectorized computation
import pandas as pd # library to process data as dataframes

import matplotlib.pyplot as plt # plotting library
# backend for rendering plots within the browser
%matplotlib inline

from sklearn.cluster import KMeans
from sklearn.datasets.samples_generator import make_blobs

print('Libraries imported.')
Libraries imported.k-means on a randomly generated dataset
Here are 30 data points belonging to 2 different clusters. x1 is the first feature and x2 is the second feature.
# data
x1 = [-4.9, -3.5, 0, -4.5, -3, -1, -1.2, -4.5, -1.5, -4.5, -1, -2, -2.5, -2, -1.5, 4, 1.8, 2, 2.5, 3, 4, 2.25, 1, 0, 1, 2.5, 5, 2.8, 2, 2]
x2 = [-3.5, -4, -3.5, -3, -2.9, -3, -2.6, -2.1, 0, -0.5, -0.8, -0.8, -1.5, -1.75, -1.75, 0, 0.8, 0.9, 1, 1, 1, 1.75, 2, 2.5, 2.5, 2.5, 2.5, 3, 6, 6.5]

print('Datapoints defined!')
Datapoints defined!Define a function that assigns each data point to a cluster.
colors_map = np.array(['b', 'r'])
def assign_members(x1, x2, centers):
    compare_to_first_center = np.sqrt(np.square(np.array(x1) - centers[0][0]) + np.square(np.array(x2) - centers[0][1]))
    compare_to_second_center = np.sqrt(np.square(np.array(x1) - centers[1][0]) + np.square(np.array(x2) - centers[1][1]))
    class_of_points = compare_to_first_center > compare_to_second_center
    colors = colors_map[class_of_points + 1 - 1]
    return colors, class_of_points

print('assign_members function defined!')
assign_members function defined!Define a function that updates the centroid of each cluster.
# update the means
def update_centers(x1, x2, class_of_points):
    center1 = [np.mean(np.array(x1)[~class_of_points]), np.mean(np.array(x2)[~class_of_points])]
    center2 = [np.mean(np.array(x1)[class_of_points]), np.mean(np.array(x2)[class_of_points])]
    return [center1, center2]

print('assign_members function defined.')
assign_members function defined.Define a function that plots the data points along with the cluster centroids.
def plot_points(centroids=None, colors='g', figure_title=None):
    # plot the figure
    fig = plt.figure(figsize=(15, 10))  # create a figure object
    ax = fig.add_subplot(1, 1, 1)

    centroid_colors = ['bx', 'rx']
    if centroids:
        for (i, centroid) in enumerate(centroids):
            ax.plot(centroid[0], centroid[1], centroid_colors[i], markeredgewidth=5, markersize=20)
    plt.scatter(x1, x2, s=500, c=colors)

    # define the ticks
    xticks = np.linspace(-6, 8, 15, endpoint=True)
    yticks = np.linspace(-6, 6, 13, endpoint=True)

    # fix the horizontal axis
    ax.set_xticks(xticks)
    ax.set_yticks(yticks)

    # add tick labels
    xlabels = xticks
    ax.set_xticklabels(xlabels)
    ylabels = yticks
    ax.set_yticklabels(ylabels)

    # style the ticks
    ax.xaxis.set_ticks_position('bottom')
    ax.yaxis.set_ticks_position('left')
    ax.tick_params('both', length=2, width=1, which='major', labelsize=15)

    # add labels to axes
    ax.set_xlabel('x1', fontsize=20)
    ax.set_ylabel('x2', fontsize=20)

    # add title to figure
    ax.set_title(figure_title, fontsize=24)

    plt.show()

print('plot_points function defined.')
plot_points function defined.Initialize k-means: plot data points.
plot_points(figure_title='Scatter Plot of x2 vs x1')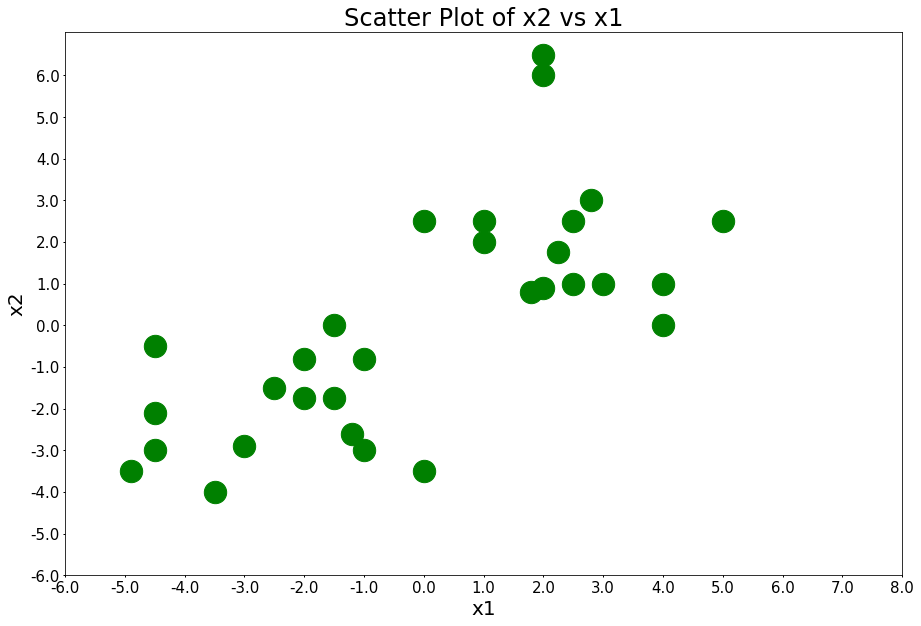
Initialize k-means: randomly define clusters and add them to the plot.
centers = [[-2,2], [2,-2]]
plot_points(centers, figure_title='k-means Initialization')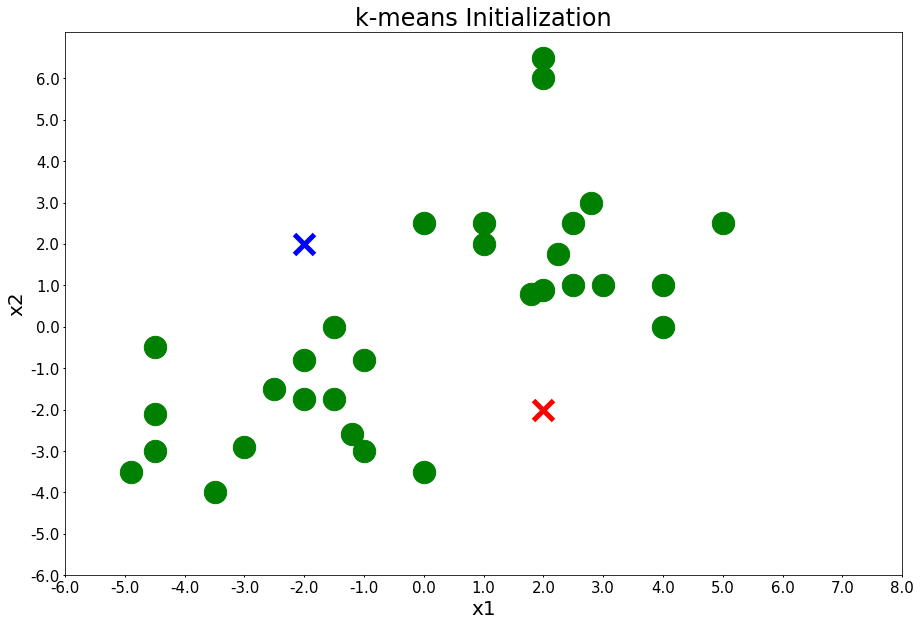
Run k-means: 4 iterations
number_of_iterations = 4
for i in range(number_of_iterations):
    input('Iteration {} - Press Enter to update the members of each cluster'.format(i + 1))
    colors, class_of_points = assign_members(x1, x2, centers)
    title = 'Iteration {} - Cluster Assignment'.format(i + 1)
    plot_points(centers, colors, figure_title=title)
    input('Iteration {} - Press Enter to update the centers'.format(i + 1))
    centers = update_centers(x1, x2, class_of_points)
    title = 'Iteration {} - Centroid Update'.format(i + 1)
    plot_points(centers, colors, figure_title=title)
Iteration 1 - Press Enter to update the members of each cluster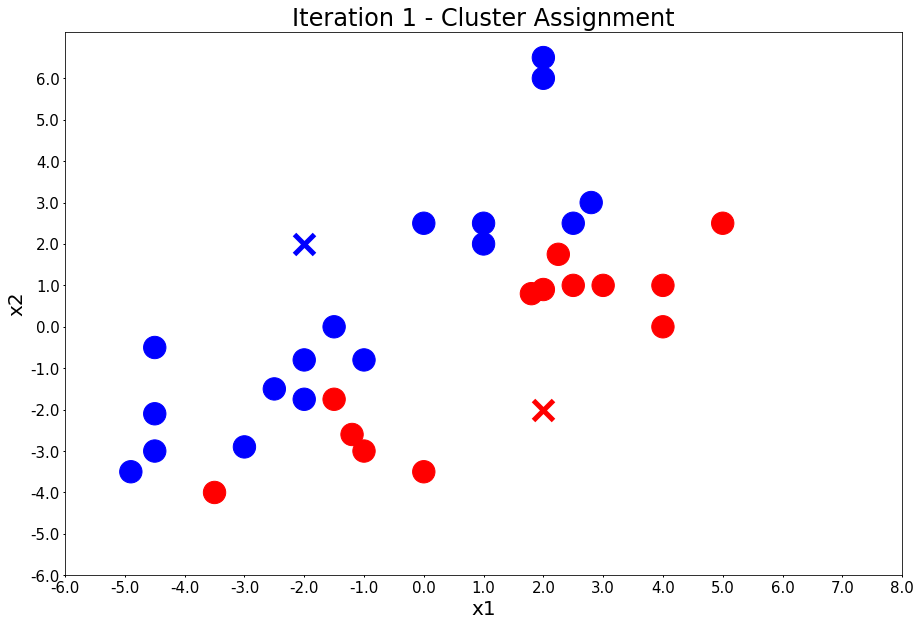
Iteration 1 - Press Enter to update the centers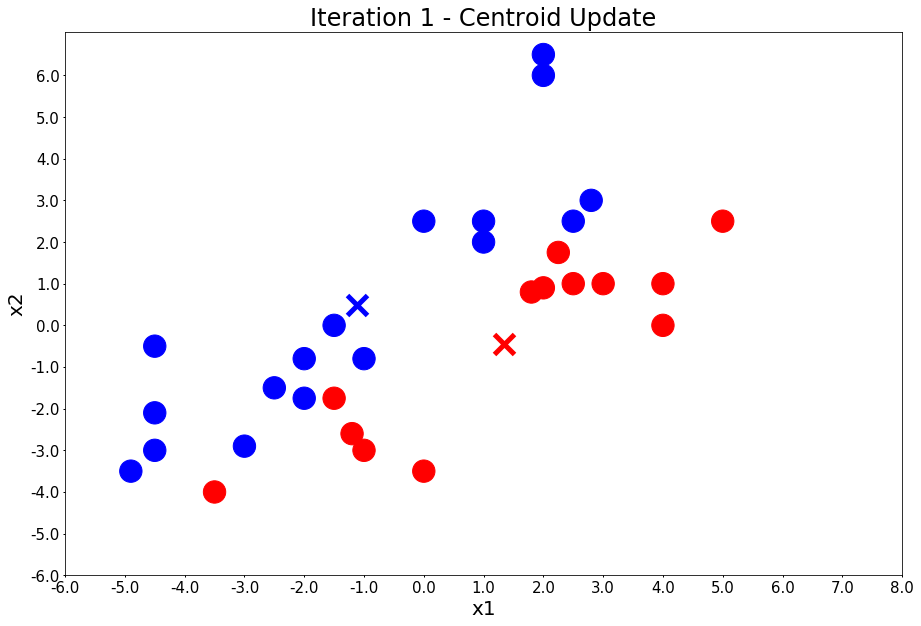
Iteration 2 - Press Enter to update the members of each cluster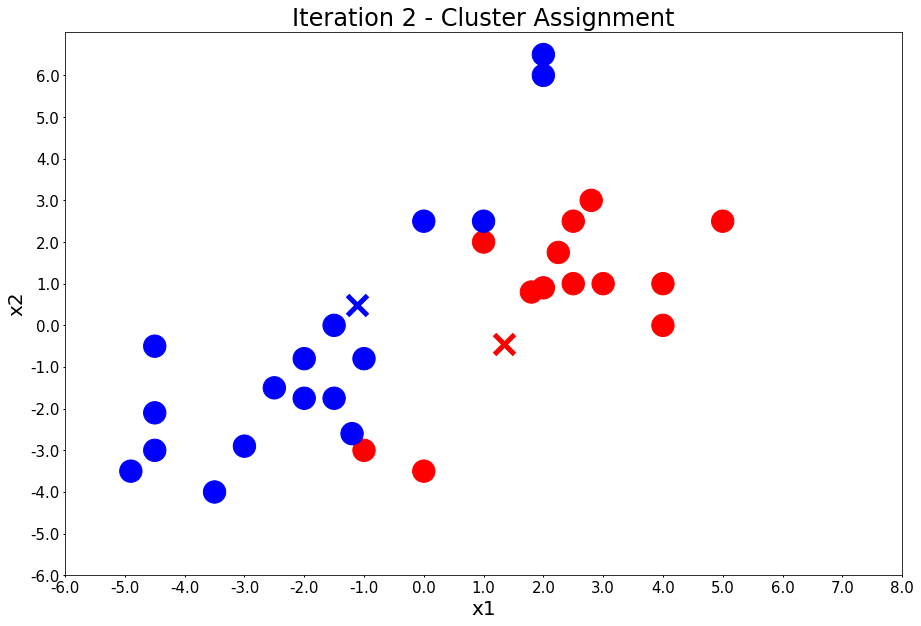
Iteration 2 - Press Enter to update the centers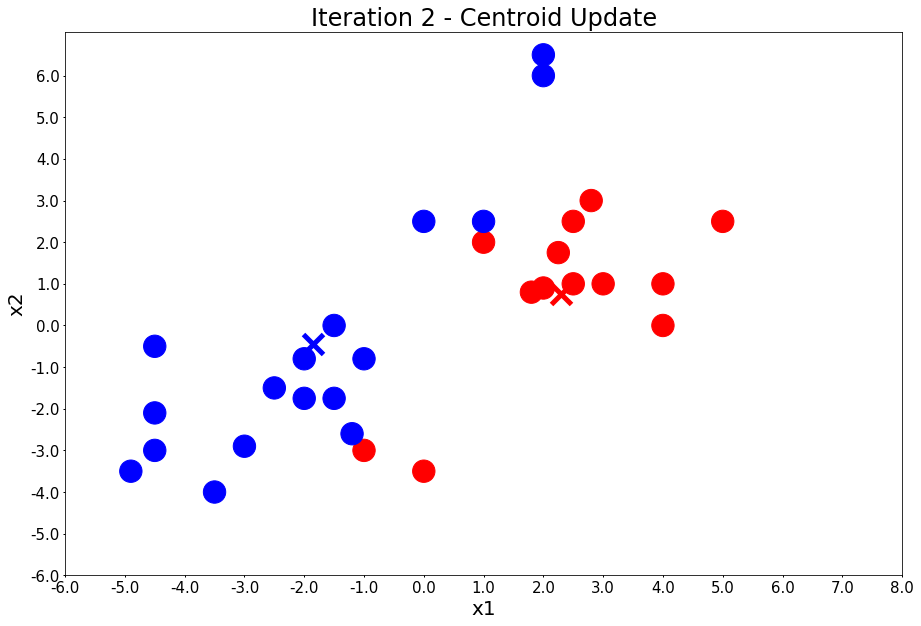
Iteration 3 - Press Enter to update the members of each cluster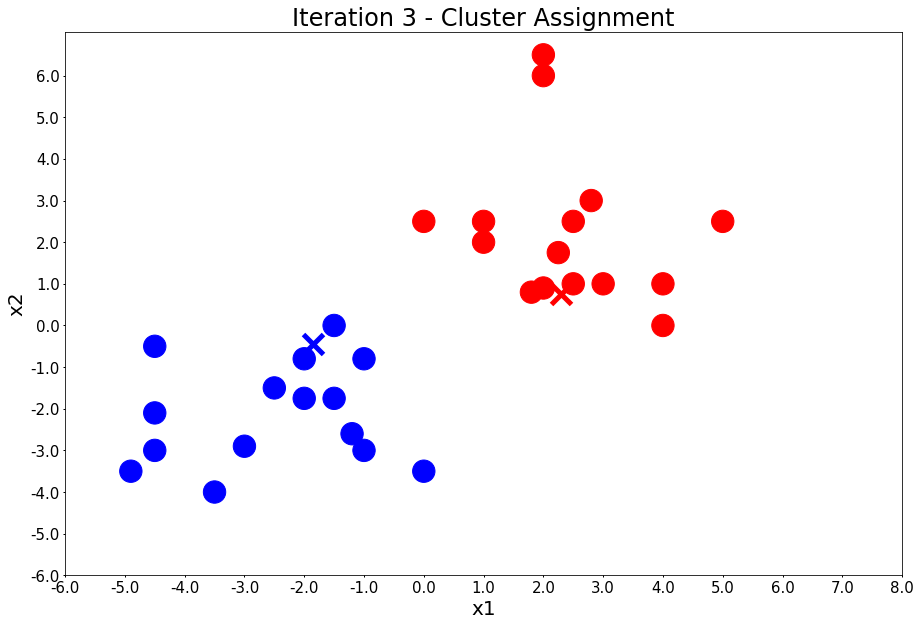
Iteration 3 - Press Enter to update the centers
Iteration 4 - Press Enter to update the members of each cluster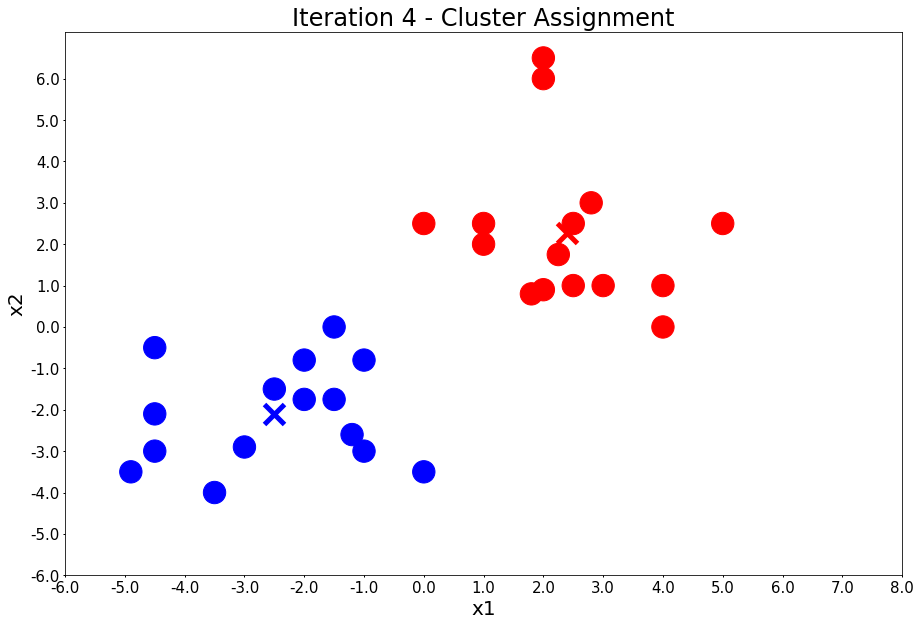
Iteration 4 - Press Enter to update the centers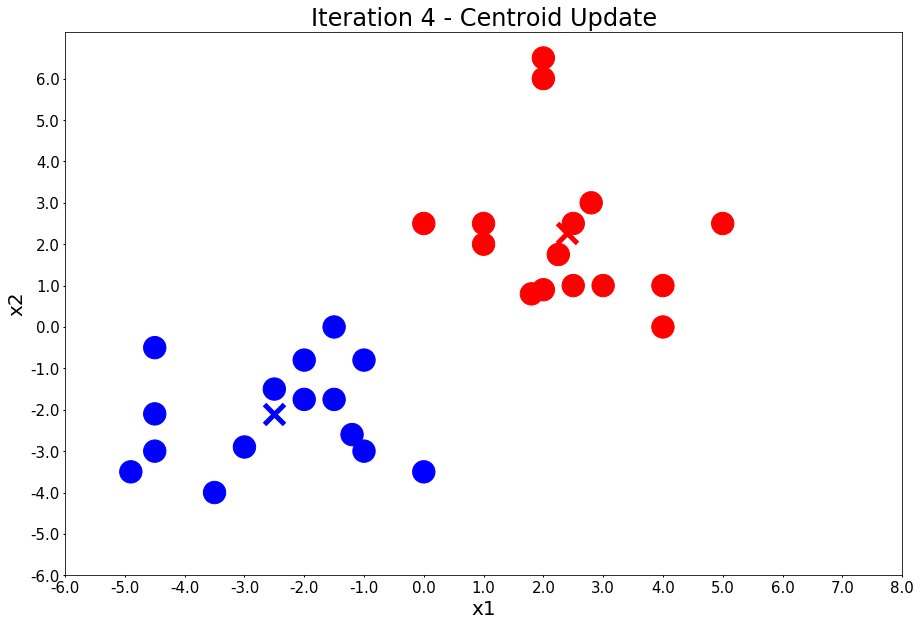
From the above example, you can visually observe how k-means works.
An example with thousands of datapoints
Let’s use the random library to generate thousands of datapoints.
Generating the data
Set up a random seed using Numpy’s random.seed() function, and set the seed to 0.
np.random.seed(0)Make random clusters of points by usinf the make_blobs class.
make_blobs class can take in many inputs, but we will use the following ones:Input
- n_samples: The total number of points equally divided among clusters.
- centers: The number of centers to generate, or the fixed center locations.
- cluster_std: The standard deviation of the clusters.
- X: Array of shape [n_samples, n_features]. (Feature Matrix)
- The generated samples.
- y: Array of shape [n_samples]. (Response Vector)
- The integer labels for cluster membership of each sample.
X, y = make_blobs(n_samples=5000, centers=[[4,4], [-2,-1], [2,-3], [1,1]], cluster_std=0.9)Display the scatter plot of the randomly generated data.
plt.figure(figsize=(15, 10))
plt.scatter(X[:,0], X[:,1], marker='.')
<matplotlib.collections.PathCollection at 0x1a1b47ac10>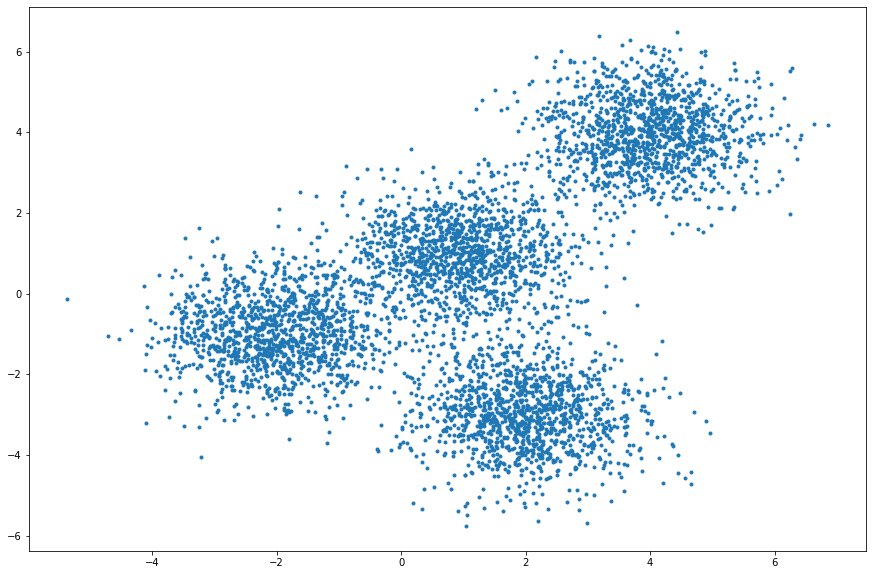
Setting up k-means
TheKMeans class has many parameters that can be used, but we will use the following three:
- init: Initialization method of the centroids.
- Value will be: “k-means++”. k-means++ selects initial cluster centers for k-means clustering in a smart way to speed up convergence.
- n_clusters: The number of clusters to form as well as the number of centroids to generate.
- Value will be 4 (since we have 4 centers)
- n_init: Number of times the k-means algorithm will be run with different centroid seeds. The final results will be the best output of n_init consecutive runs in terms of inertia.
Initialize KMeans with the above parameters, where the output parameter is called k_means.
k_means = KMeans(init='k-means++', n_clusters=4, n_init=12)Fit the KMeans model with the feature matrix X we created above.
k_means.fit(X)KMeans(algorithm='auto', copy_x=True, init='k-means++', max_iter=300,
n_clusters=4, n_init=12, n_jobs=None, precompute_distances='auto',
random_state=None, tol=0.0001, verbose=0)Grab the labels for each point in the model using the KMeans .labels_ attribute and save it as k_means_labels.
k_means_labels = k_means.labels_
k_means_labels
array([0, 3, 3, ..., 1, 0, 0], dtype=int32)Get the coordinates of the cluster centers using KMeans .cluster_centers_ and save it as k_means_cluster_centers.
k_means_cluster_centers = k_means.cluster_centers_
k_means_cluster_centers
array([[-2.03743147, -0.99782524],
[ 3.97334234, 3.98758687],
[ 0.96900523, 0.98370298],
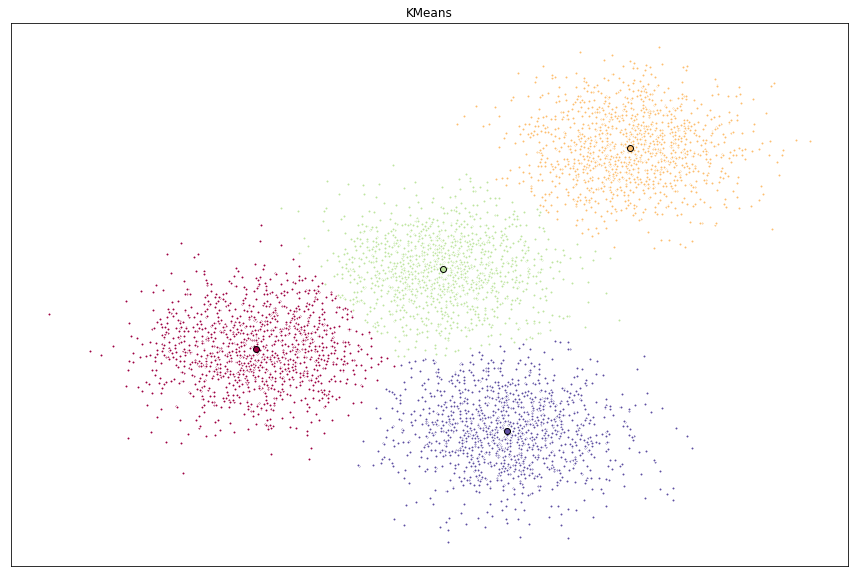
[ 1.99741008, -3.01666822]])Visualizing the resulting clusters
Now that we have the random data generated and the KMeans model initialized, let’s plot them and see what the cluster looks like.
# initialize the plot with the specified dimensions.
fig = plt.figure(figsize=(15, 10))

# colors uses a color map, which will produce an array of colors based on
# the number of labels. We use set(k_means_labels) to get the
# unique labels.
colors = plt.cm.Spectral(np.linspace(0, 1, len(set(k_means_labels))))

# create a plot
ax = fig.add_subplot(1, 1, 1)

# loop through the data and plot the datapoints and centroids.
# k will range from 0-3, which will match the number of clusters in the dataset.
for k, col in zip(range(len([[4,4], [-2, -1], [2, -3], [1, 1]])), colors):

    # create a list of all datapoints, where the datapoitns that are
    # in the cluster (ex. cluster 0) are labeled as true, else they are
    # labeled as false.
    my_members = (k_means_labels == k)

    # define the centroid, or cluster center.
    cluster_center = k_means_cluster_centers[k]

    # plot the datapoints with color col.
    ax.plot(X[my_members, 0], X[my_members, 1], 'w', markerfacecolor=col, marker='.')

    # plot the centroids with specified color, but with a darker outline
    ax.plot(cluster_center[0], cluster_center[1], 'o', markerfacecolor=col,  markeredgecolor='k', markersize=6)

# title of the plot
ax.set_title('KMeans')

# remove x-axis ticks
ax.set_xticks(())

# remove y-axis ticks
ax.set_yticks(())

# show the plot
plt.show()